Visium HD example (bins)#
This notebook demonstrates how to visualize Visium HD data.
For Visium HD, because the spots are squares aranged in a grid, we can visualize them as bins. For other untargeted platforms (e.g. Nova-ST, BMK), this is not as straightforward because the bins are hexagons, and we advise to use hpv.seq_based_from_split_sources, we refer to this notebook.
import harpy_vitessce as hpv
import tempfile
from pathlib import Path

tmp_dir = Path(tempfile.mkdtemp(prefix="visium_HD"))
import os

import harpy as hp
import pooch
from harpy.datasets import get_registry
from spatialdata import read_zarr

BASE_DIR = tmp_dir  # change the base directory

# fetch the data
registry = get_registry()
unzip_path = registry.fetch(
    "transcriptomics/visium_hd/mouse/visium_hd_mouse_small_intestine.zip",
    processor=pooch.Unzip(),
)

# path to a visium experiment
path = os.path.commonpath(unzip_path)

# read the downloaded data with harpy.
# when reading visium data with harpy, the table is annotated by a labels element, and the feature matrix .X is a sparse csc matrix.
sdata = hp.io.visium_hd(
    path=path,
    bin_size=[16],
    dataset_id="Visium_HD_Mouse_Small_Intestine",
    output=os.path.join(BASE_DIR, "sdata_visium_hd.zarr"),
)

sdata = read_zarr(os.path.join(BASE_DIR, "sdata_visium_hd.zarr"))
INFO     The instance_key column in 'table.obs' ('table.obs[location_id]') will be relabeled to ensure a numeric
         data type, with a continuous range and without including the value 0 (which is reserved for the
         background). The new labels will be stored in a new column named 'relabeled_location_id'.
Run a Scanpy pipeline
from harpy_vitessce.data_utils import (
    copy_annotations,
    downcast_int64_to_int32,
    example_visium_hd_processing,
)

microns_per_pixel = 0.27376126715315274  # microns per pixel

adata = sdata["square_016um"].copy()
# takes around 5 minutes
adata = example_visium_hd_processing(
    adata,
    spatial_spot_size=100,  # for visualization
    min_counts=20,
    target_sum=None,
)

# copy the annotation from the preprocessed adata to the adata with the raw counts (we want to visualize these)

adata_annotated = copy_annotations(
    src=adata,
    tgt=sdata["square_016um"],
    obs_keys=["leiden", "total_counts", "n_genes_by_counts"],
    obsm_keys=["X_umap"],
)
# vitessce can not work with int64
_df, _, _ = downcast_int64_to_int32(
    adata_annotated.obs,
    strict=True,
)
adata_annotated.obs = _df
filtered out 143 cells that have less than 20 counts
filtered out 436 genes that are detected in less than 10 cells
normalizing counts per cell
finished (0:00:01)
extracting highly variable genes
finished (0:00:01)
--> added
'highly_variable', boolean vector (adata.var)
'means', float vector (adata.var)
'dispersions', float vector (adata.var)
'dispersions_norm', float vector (adata.var)
computing PCA
with n_comps=50
finished (0:01:33)
computing neighbors
using 'X_pca' with n_pcs = 30
finished: added to `.uns['neighbors']`
`.obsp['distances']`, distances for each pair of neighbors
`.obsp['connectivities']`, weighted adjacency matrix (0:00:19)
computing UMAP
finished: added
'X_umap', UMAP coordinates (adata.obsm)
'umap', UMAP parameters (adata.uns) (0:00:39)
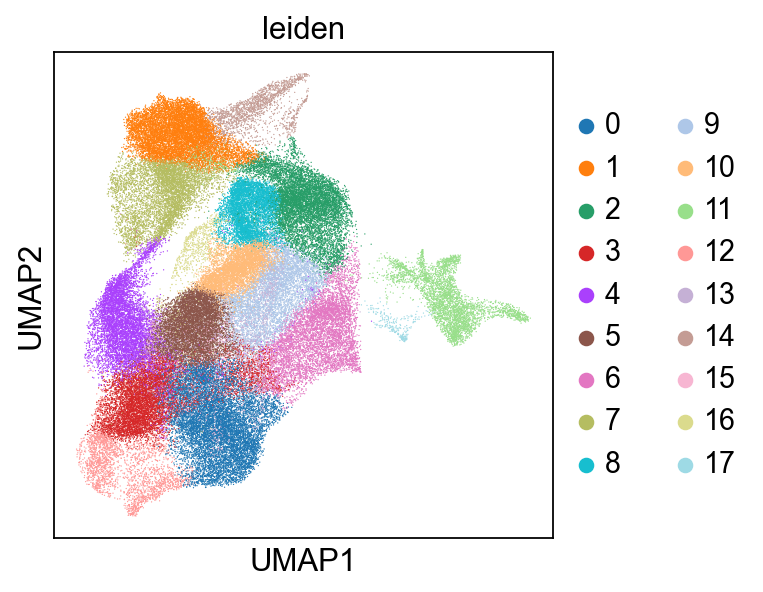
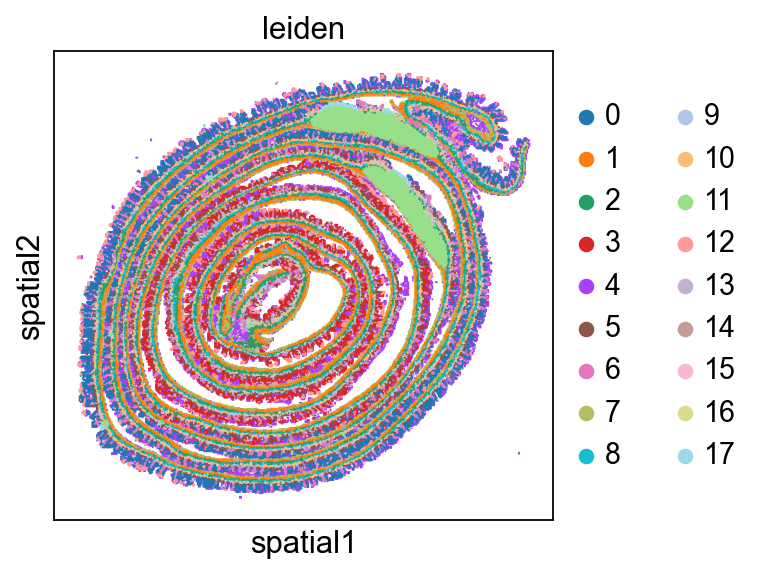
running Leiden clustering
finished: found 18 clusters and added
'leiden', the cluster labels (adata.obs, categorical) (0:04:00)
adata_annotated.obs.head()
| in_tissue | array_row | array_col | fov_labels | cell_ID | leiden | total_counts | n_genes_by_counts | |
|---|---|---|---|---|---|---|---|---|
| s_016um_00144_00175-1 | 1 | 144 | 175 | Visium_HD_Mouse_Small_Intestine_square_016um_l... | 1 | 4 | 313.0 | 249 |
| s_016um_00145_00029-1 | 1 | 145 | 29 | Visium_HD_Mouse_Small_Intestine_square_016um_l... | 2 | 9 | 2819.0 | 1733 |
| s_016um_00165_00109-1 | 1 | 165 | 109 | Visium_HD_Mouse_Small_Intestine_square_016um_l... | 3 | 9 | 2615.0 | 1644 |
| s_016um_00297_00147-1 | 1 | 297 | 147 | Visium_HD_Mouse_Small_Intestine_square_016um_l... | 4 | 13 | 2860.0 | 1419 |
| s_016um_00287_00091-1 | 1 | 287 | 91 | Visium_HD_Mouse_Small_Intestine_square_016um_l... | 5 | 5 | 2854.0 | 1731 |
Write the AnnData table to Zarr#
from spatialdata.models import TableModel

# Because we needed to use the AnnDataWrapper to add quality control metrics, we need to make sure the index of the AnnData table matches ID's in the spatial element representing the bins:
adata_annotated.obs.index = adata_annotated.obs["cell_ID"].values

# and back to zarr:
sdata = hp.tb.add_table(
    sdata,
    adata=adata_annotated.copy(),
    region=adata_annotated.uns[TableModel.ATTRS_KEY][TableModel.REGION_KEY],
    output_table_name="square_016um_annotated",
    overwrite=True,
)
Add a micron coordinate system.#
from spatialdata.transformations import (
    Scale,
    Sequence,
    get_transformation,
    set_transformation,
)

microns_per_pixel = 0.27376126715315274

# add a micron coordinate system to the H&E and to the labels layer representing the bins
to_coordinate_system = "Visium_HD_Mouse_Small_Intestine"

for _name in [
    "Visium_HD_Mouse_Small_Intestine_square_016um_labels",  # labels layer with the bins
    "Visium_HD_Mouse_Small_Intestine_full_image",  # H&E
]:
    transformations = get_transformation(sdata[_name], get_all=True)
    t = transformations[to_coordinate_system]

    scale = Scale(
        scale=[microns_per_pixel, microns_per_pixel], axes=("x", "y")
    )  # add extra scaling to go to microns
    t = Sequence([t, scale])

    set_transformation(
        sdata[_name],
        transformation=t,
        set_all=False,
        to_coordinate_system=f"{to_coordinate_system}_micron",
        write_to_sdata=sdata,
    )
Create Vitessce config#
from IPython.display import HTML, display

vc = hpv.seq_based_from_spatialdata(
    sdata_path=sdata.path,
    image_name="Visium_HD_Mouse_Small_Intestine_full_image",
    table_name="square_016um_annotated",  # make sure index matches ID's in labels layer if you want to visualize qc metrics.
    labels_name="Visium_HD_Mouse_Small_Intestine_square_016um_labels",
    to_coordinate_system="Visium_HD_Mouse_Small_Intestine_micron",  # plot in microns
    cluster_key="leiden",
    cluster_key_display_name="Leiden",
    qc_obs_feature_keys=["total_counts", "n_genes_by_counts"],
    embedding_key="X_umap",
    embedding_display_name="UMAP",
)

url = vc.web_app()
display(HTML(f'<a href="{url}" target="_blank">Open in Vitessce</a>'))