Visium HD Example (spots)#
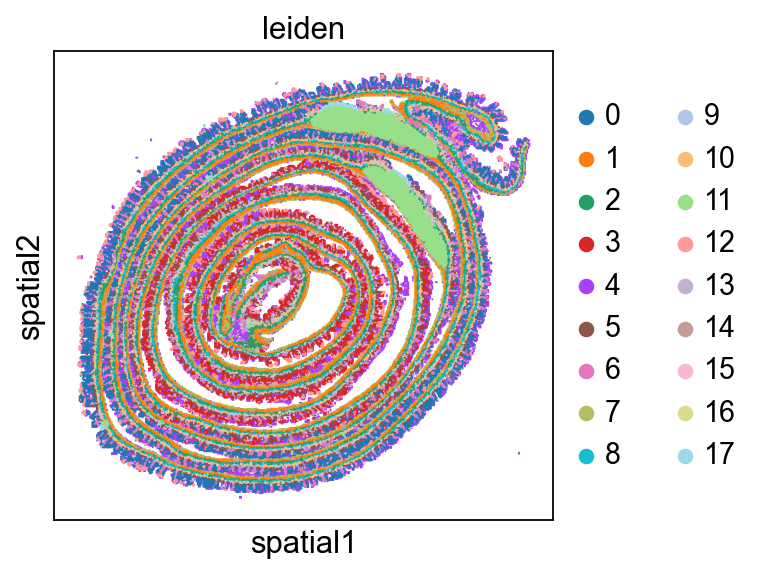
This notebook shows how to visualize Visium HD data at spot level.
It uses a SpotLayer linked to adata.obsm[spatial_key]. For a bin-level visualization, see this notebook.
import harpy_vitessce as hpv
import tempfile
from pathlib import Path

tmp_dir = Path(tempfile.mkdtemp(prefix="visium_HD"))
import os

import harpy as hp
import pooch
from harpy.datasets import get_registry
from spatialdata import read_zarr

BASE_DIR = tmp_dir  # change the base directory

# fetch the data
registry = get_registry()
unzip_path = registry.fetch(
    "transcriptomics/visium_hd/mouse/visium_hd_mouse_small_intestine.zip",
    processor=pooch.Unzip(),
)

# path to a visium experiment
path = os.path.commonpath(unzip_path)

# read the downloaded data with harpy.
sdata = hp.io.visium_hd(
    path=path,
    bin_size=[16],
    dataset_id="Visium_HD_Mouse_Small_Intestine",
    output=os.path.join(BASE_DIR, "sdata_visium_hd.zarr"),
)

sdata = read_zarr(os.path.join(BASE_DIR, "sdata_visium_hd.zarr"))
INFO     The instance_key column in 'table.obs' ('table.obs[location_id]') will be relabeled to ensure a numeric
         data type, with a continuous range and without including the value 0 (which is reserved for the
         background). The new labels will be stored in a new column named 'relabeled_location_id'.
Run a Scanpy pipeline
from harpy_vitessce.data_utils import (
    copy_annotations,
    downcast_int64_to_int32,
    example_visium_hd_processing,
)

microns_per_pixel = 0.27376126715315274  # microns per pixel

adata = sdata["square_016um"].copy()
# takes around 5 minutes
adata = example_visium_hd_processing(
    adata,
    spatial_spot_size=100,  # for visualization
    min_counts=20,
    target_sum=None,
)

# copy the annotation from the preprocessed adata to the adata with the raw counts (we want to visualize these)

adata_annotated = copy_annotations(
    src=adata,
    tgt=sdata["square_016um"],
    obs_keys=["leiden", "total_counts", "n_genes_by_counts"],
    obsm_keys=["X_umap"],
)
# vitessce can not work with int64
_df, _, _ = downcast_int64_to_int32(
    adata_annotated.obs,
    strict=True,
)
adata_annotated.obs = _df
filtered out 143 cells that have less than 20 counts
filtered out 436 genes that are detected in less than 10 cells
normalizing counts per cell
finished (0:00:01)
extracting highly variable genes
finished (0:00:01)
--> added
'highly_variable', boolean vector (adata.var)
'means', float vector (adata.var)
'dispersions', float vector (adata.var)
'dispersions_norm', float vector (adata.var)
computing PCA
with n_comps=50
finished (0:01:36)
computing neighbors
using 'X_pca' with n_pcs = 30
finished: added to `.uns['neighbors']`
`.obsp['distances']`, distances for each pair of neighbors
`.obsp['connectivities']`, weighted adjacency matrix (0:00:18)
computing UMAP
finished: added
'X_umap', UMAP coordinates (adata.obsm)
'umap', UMAP parameters (adata.uns) (0:00:38)
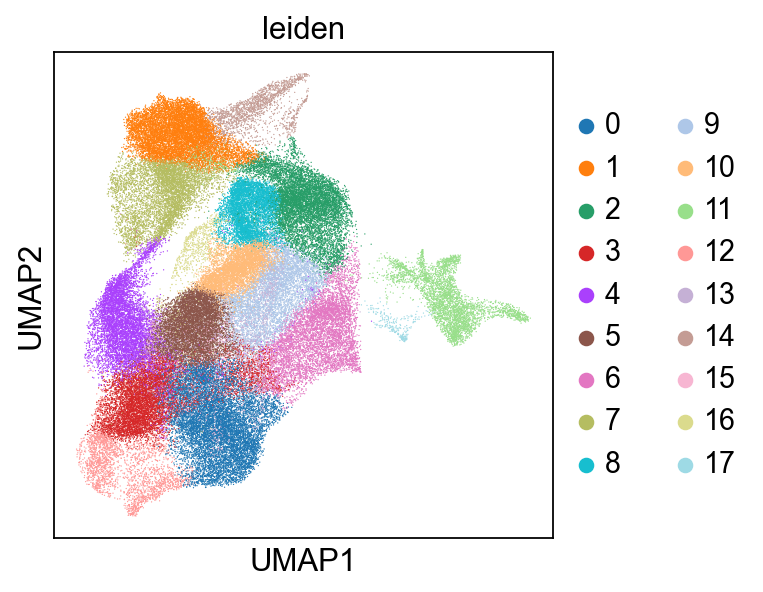
running Leiden clustering
finished: found 18 clusters and added
'leiden', the cluster labels (adata.obs, categorical) (0:04:06)
Add AnnData to the SpatialData zarr store, and add a spatial key in microns.#
from spatialdata.models import TableModel

# convert to micron, because we will use this spatial key to visualize the bins/spots
adata_annotated.obsm["spatial_microns"] = (
    adata_annotated.obsm["spatial"] * microns_per_pixel
)

sdata = hp.tb.add_table(
    sdata,
    adata=adata_annotated.copy(),
    region=adata_annotated.uns[TableModel.ATTRS_KEY][TableModel.REGION_KEY],
    output_table_name="square_016um_annotated",
    overwrite=True,
)
Add a global coordinate system.#
from spatialdata.transformations import (
    Identity,
    set_transformation,
)

# add a global coordinate system -> required by vitessce when rendering from ome zarr source.
set_transformation(
    sdata["Visium_HD_Mouse_Small_Intestine_full_image"],
    transformation=Identity(),
    set_all=False,
    to_coordinate_system="global",
    write_to_sdata=sdata,  # back to zarr
)
Create Vitessce config#
import numpy as np

# get the center of the tissue
xy = sdata["square_016um_annotated"].obsm["spatial_microns"]
center_x = float(np.mean(xy[:, 0]))
center_y = float(np.mean(xy[:, 1]))
from IPython.display import HTML, display

vc = hpv.seq_based_from_split_sources(
    image_source=sdata.path / "images" / "Visium_HD_Mouse_Small_Intestine_full_image",
    adata_source=sdata.path
    / "tables"
    / "square_016um_annotated",  # We use spot based implementation of vitessce, so vitessce will look at .obsm["spatial_microns"]
    cluster_key="leiden",
    cluster_key_display_name="Leiden",
    spatial_key="spatial_microns",  # obsm in microns
    microns_per_pixel=microns_per_pixel,  # add a scale when rendering
    spot_radius_size_micron=8,  # 16//2
    visualize_as_rgb=True,
    center=(center_x, center_y),
    zoom=-3.2,
    qc_obs_feature_keys=["total_counts", "n_genes_by_counts"],
    embedding_key="X_umap",
    embedding_display_name="UMAP",
)

url = vc.web_app()
display(HTML(f'<a href="{url}" target="_blank">Open in Vitessce</a>'))